Node Configuration
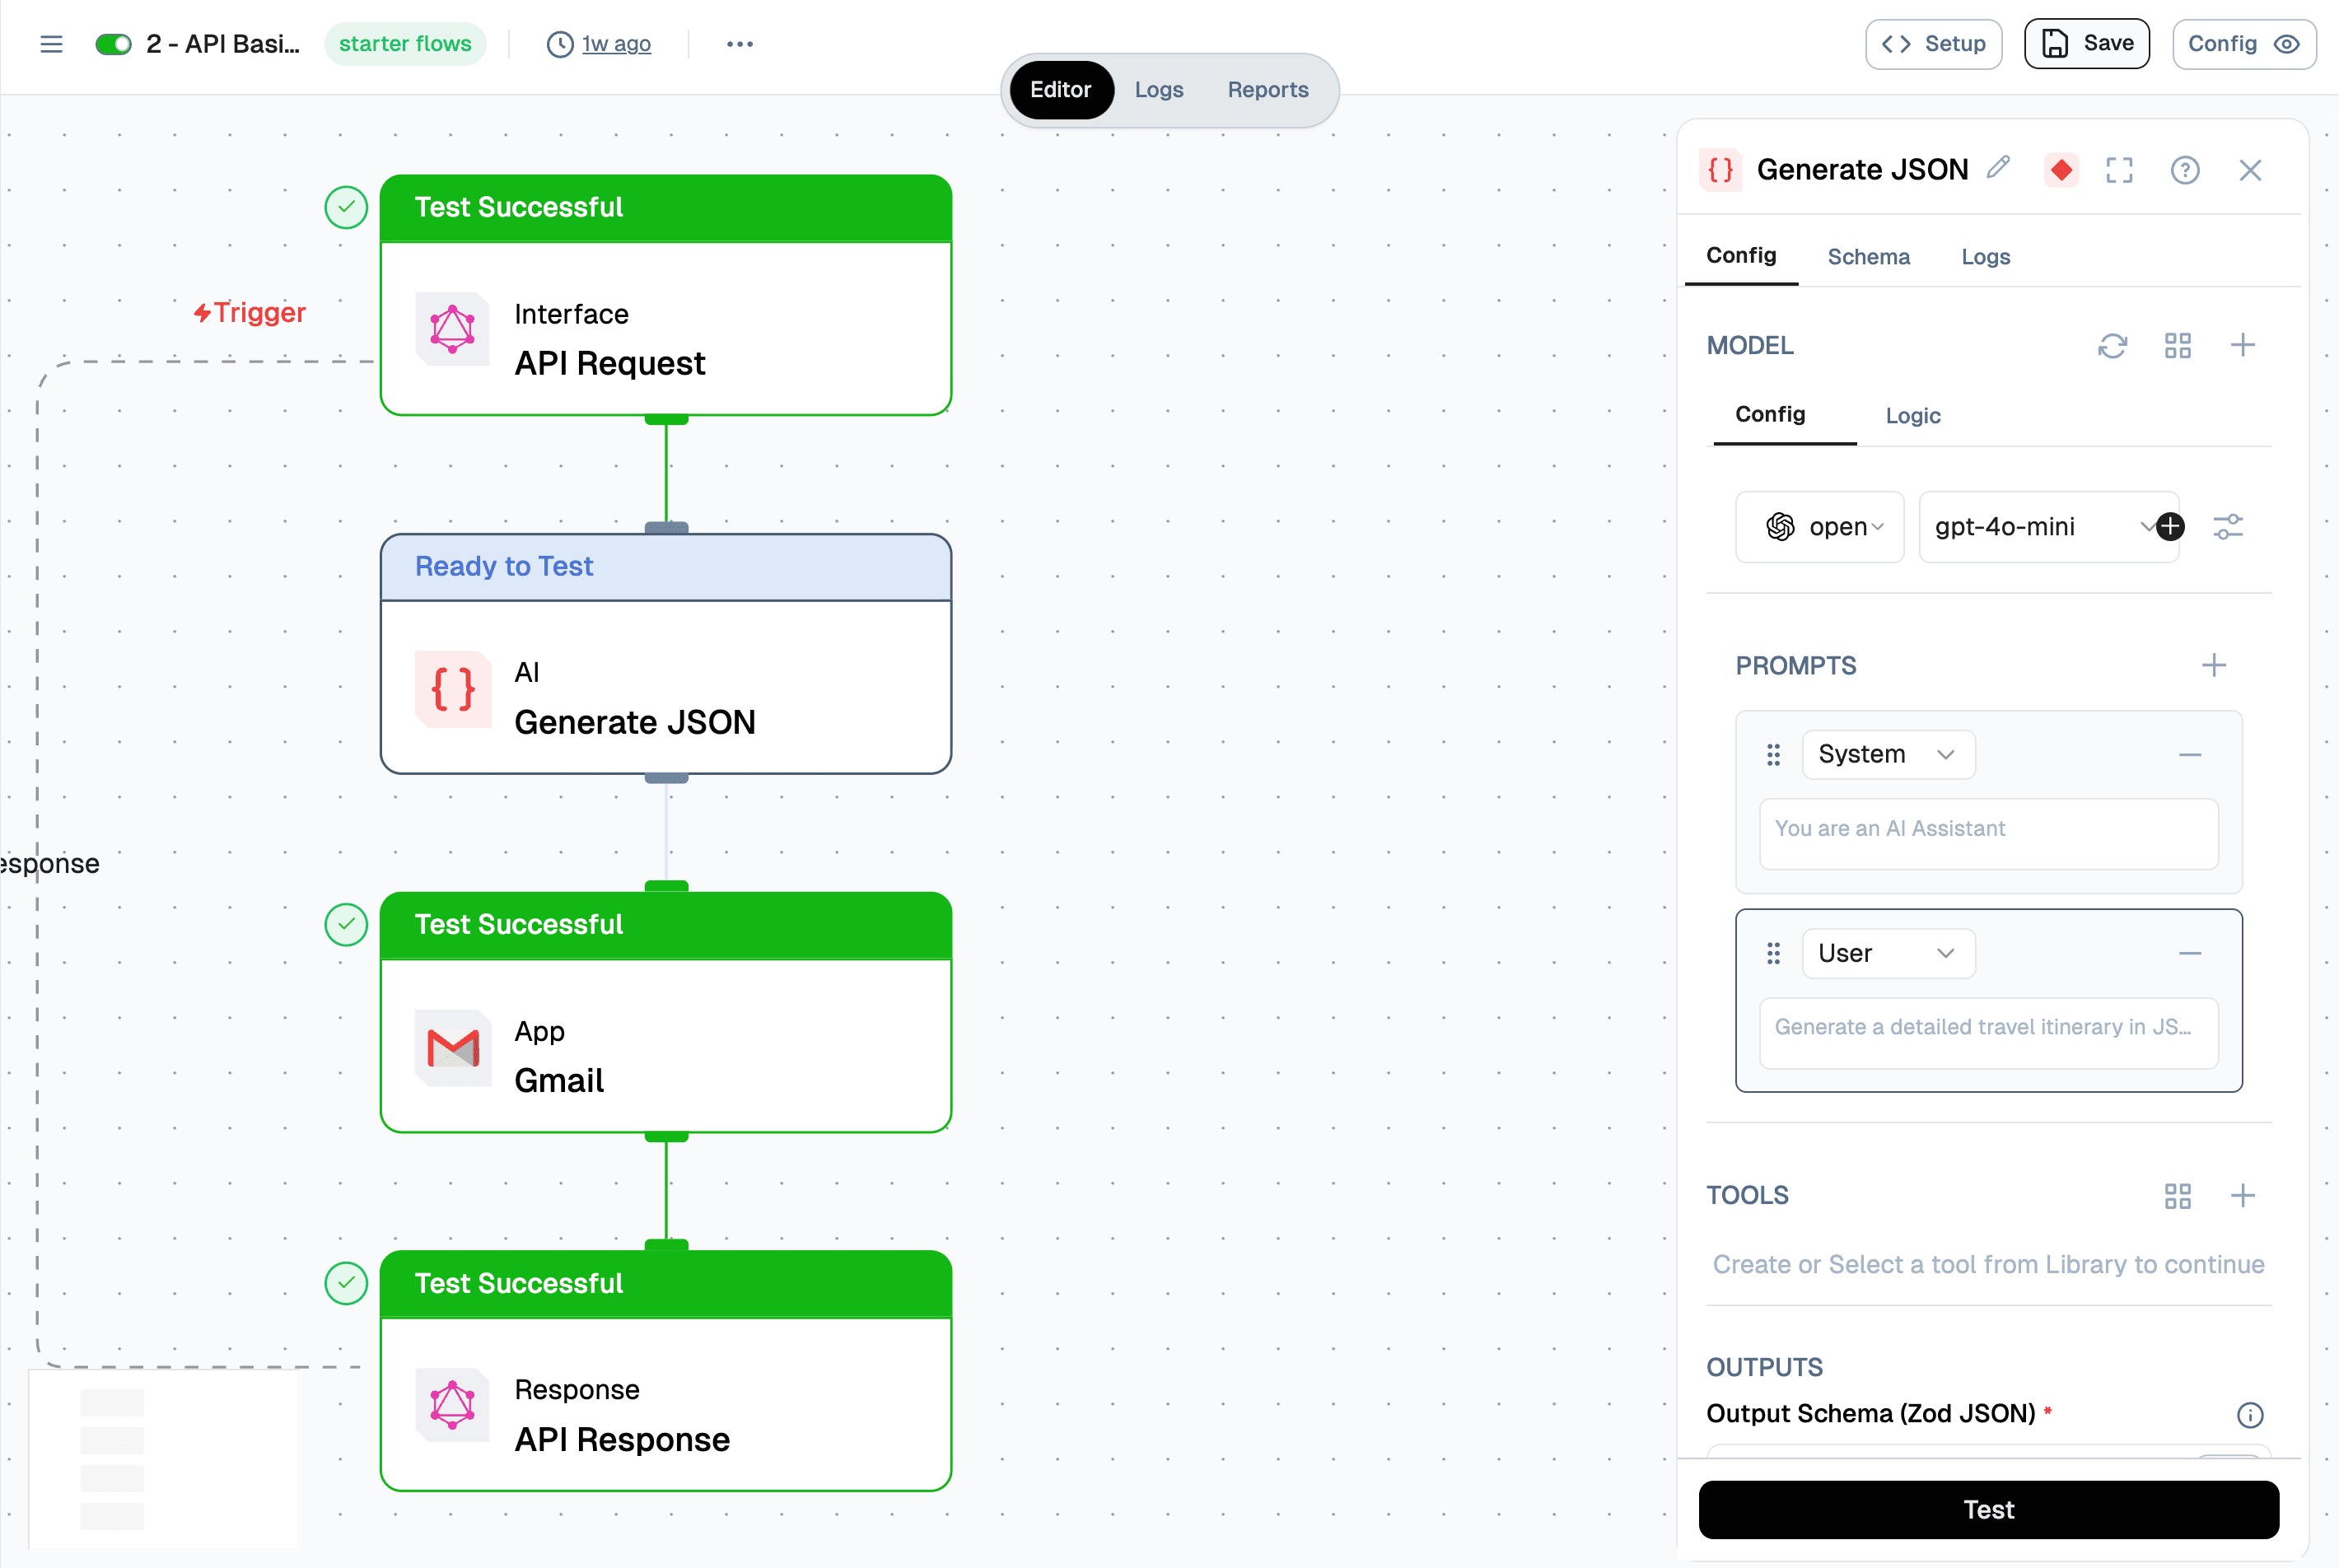
The Node Configuration panel provides a comprehensive interface for configuring individual nodes within your flow. When you select a node in the Editor, the configuration panel appears on the right side of the screen, allowing you to customize the node's behavior, define its schema, and monitor its execution logs.
The configuration panel is organized into three main tabs: Config, Schema, and Logs. Each tab serves a specific purpose in managing and debugging your nodes.
Config
The Config tab contains node-specific configuration settings that determine how the node operates within your flow. The exact configuration options vary depending on the node type, but common sections include:
Schema
The Schema tab displays the node's input and output schema definitions. This helps you understand:
- Input Schema: The expected structure and types of data the node accepts
- Output Schema: The structure and types of data the node produces
- Schema Validation: Ensures data integrity throughout the flow
Method:
- Select a node in your flow.
- Click on the "Schema" tab in the configuration panel.
- Review the input schema to understand what data the node expects.
- Review the output schema to see what data will be available for subsequent nodes.
- Use this information when connecting nodes and referencing outputs in your flow.
Understanding the schema is crucial for:
- Properly connecting nodes in your flow
- Using variable references correctly
- Ensuring data type compatibility between nodes
- Debugging flow issues related to data structure
Logs
The Logs tab provides detailed execution logs when you test a flow or individual nodes. This is essential for debugging and monitoring node behavior:
- Execution History: View logs from previous test runs
- Real-time Logging: Monitor node execution in real-time during testing
- Error Messages: Identify and diagnose issues with detailed error information
- Performance Metrics: Track execution time and resource usage
Method:
- Select the node you want to monitor.
- Click on the "Logs" tab in the configuration panel.
- Execute a test by clicking the "Test" button in the Config tab.
- Review the logs to see:
- Execution steps and progress
- Input and output data
- Any errors or warnings
- Performance information
- Use log information to identify and fix configuration issues.
Understanding Log Information
Logs typically include:
- Timestamp: When the node executed
- Status: Success, error, or warning indicators
- Input Data: The data received by the node
- Output Data: The data produced by the node
- Error Details: Specific error messages and stack traces if issues occurred
Best Practices
- Configure Before Testing: Complete all required fields in the Config tab before running tests.
- Review Schema: Always check the Schema tab to understand data structures before connecting nodes.
- Monitor Logs: Regularly review logs during development to catch issues early.
- Test Incrementally: Test individual nodes before testing the entire flow.
- Use Descriptive Prompts: Write clear, specific prompts in the PROMPTS section for better AI performance.
- Validate Outputs: Ensure output schemas match the expected format for downstream nodes.
By effectively using the Config, Schema, and Logs tabs, you can build, configure, and debug nodes efficiently, ensuring your flows operate as intended.