Reports
Reports are in alpha
Reports is currently an alpha feature, and not publicly available. If you see inaccuracies please report to support.
Gain comprehensive insights into your project's performance with our centralized reporting system. Access critical project metrics and analytics all in one convenient location, enabling you to make data-driven decisions efficiently.
The Reports Dashboard provides detailed analytics and insights into your project usage in Lamatic.
It helps you track tokens, costs, response times, and error rates across different flows.
Overview
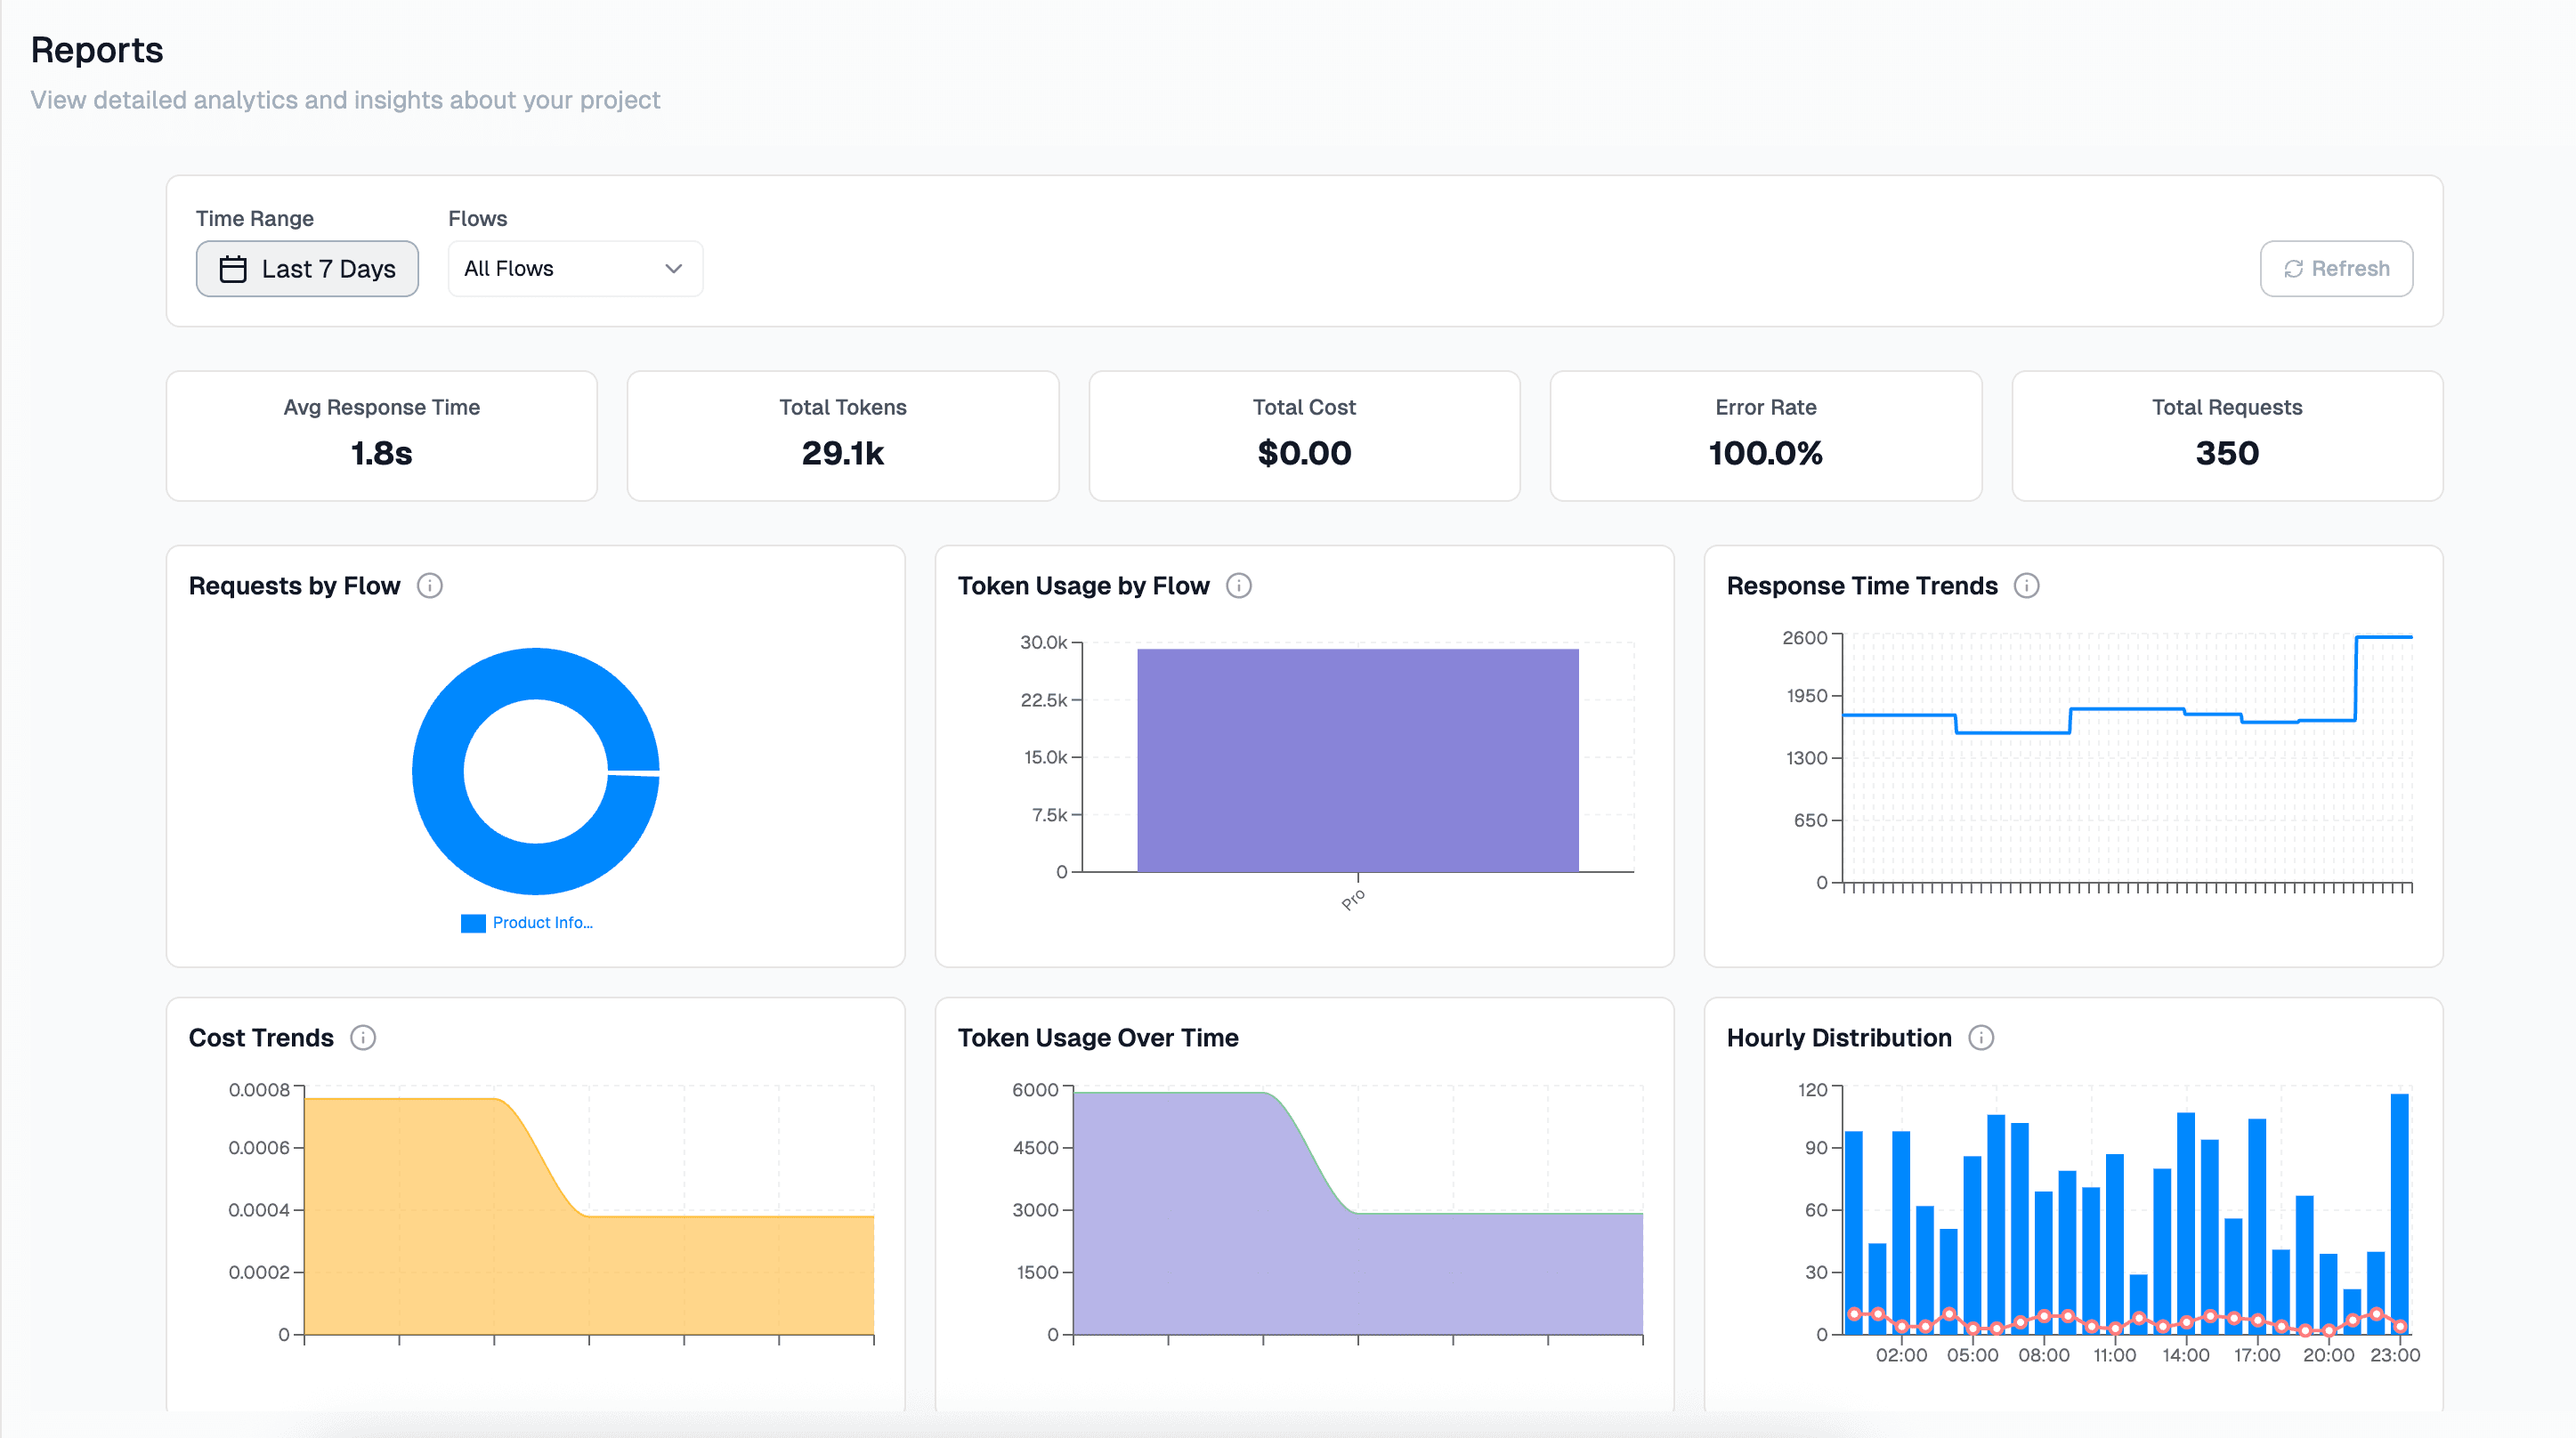
At the top of the dashboard, you’ll find quick stats:
- Avg Response Time → Average time taken to respond (e.g.,
1.8s) - Total Tokens → Total tokens consumed across flows (e.g.,
29.1k) - Total Cost → Total cost calculated based on token usage (e.g.,
$0.00) - Error Rate → Percentage of requests that resulted in errors (e.g.,
100%) - Total Requests → Number of total requests processed (e.g.,
350)
You can filter the reports by Time Range and Flows.
Report Widgets
| Widget | Description |
|---|---|
| Requests by Flow | Pie chart showing the distribution of requests across flows. Helps identify which flow is used most frequently. |
| Token Usage by Flow | Bar graph showing how many tokens each flow consumed. Useful for understanding resource-heavy flows. |
| Response Time Trends | Line graph tracking average response times over the selected period. Helps detect performance degradation. |
| Cost Trends | Chart showing token cost trends over time. Useful for monitoring budget and cost efficiency. |
| Token Usage Over Time | Line chart showing how token usage changes throughout the selected timeframe. |
| Hourly Distribution | Bar chart showing requests distribution per hour. Useful for identifying peak usage times. |
| Error Trends | Chart showing error rate trends over time. Helps debug recurring issues. |
| Token Costs by Flow | Breakdown of token costs per flow. Identifies the most expensive flows. |
Usage
Use this dashboard to:
- Track performance across different flows
- Monitor errors and optimize flows accordingly
- Analyze token usage and cost trends
- Understand when your project is most active
ℹ️ Tip: Use filters (
Time Range,Flows) to narrow down the insights for specific scenarios.